Java Logging Best Practices: The Difference Between Debugging for Hours and Minutes
Structured logging, MDC for request tracing, log levels that make sense, and how to find that one request in millions of log lines.
Moshiour Rahman
Advertisement
The Logging Horror Story
It’s 3 AM. Production is broken. You’re staring at logs like this:
INFO  - Processing request
ERROR - Something went wrong
INFO  - Done
ERROR - Failed
INFO  - Processing request
ERROR - Something went wrong
Which request failed? What user? What input caused it? You have no idea.
What Good Logs Look Like
{
  "timestamp": "2024-01-15T03:14:22.847Z",
  "level": "ERROR",
  "logger": "io.techyowls.OrderService",
  "message": "Failed to process order",
  "requestId": "req-7f3a2b1c",
  "userId": "user-12345",
  "orderId": "ord-98765",
  "error": "InsufficientInventoryException",
  "errorMessage": "Product SKU-123 has 0 units, requested 5",
  "duration_ms": 234
}
Now you know exactly what happened, to whom, and why.
Setup: SLF4J + Logback (Spring Boot Default)
<!-- Already included with spring-boot-starter -->
<dependency>
    <groupId>org.springframework.boot</groupId>
    <artifactId>spring-boot-starter</artifactId>
</dependency>

<!-- For structured JSON logging -->
<dependency>
    <groupId>net.logstash.logback</groupId>
    <artifactId>logstash-logback-encoder</artifactId>
    <version>7.4</version>
</dependency>
Log Levels: When to Use What
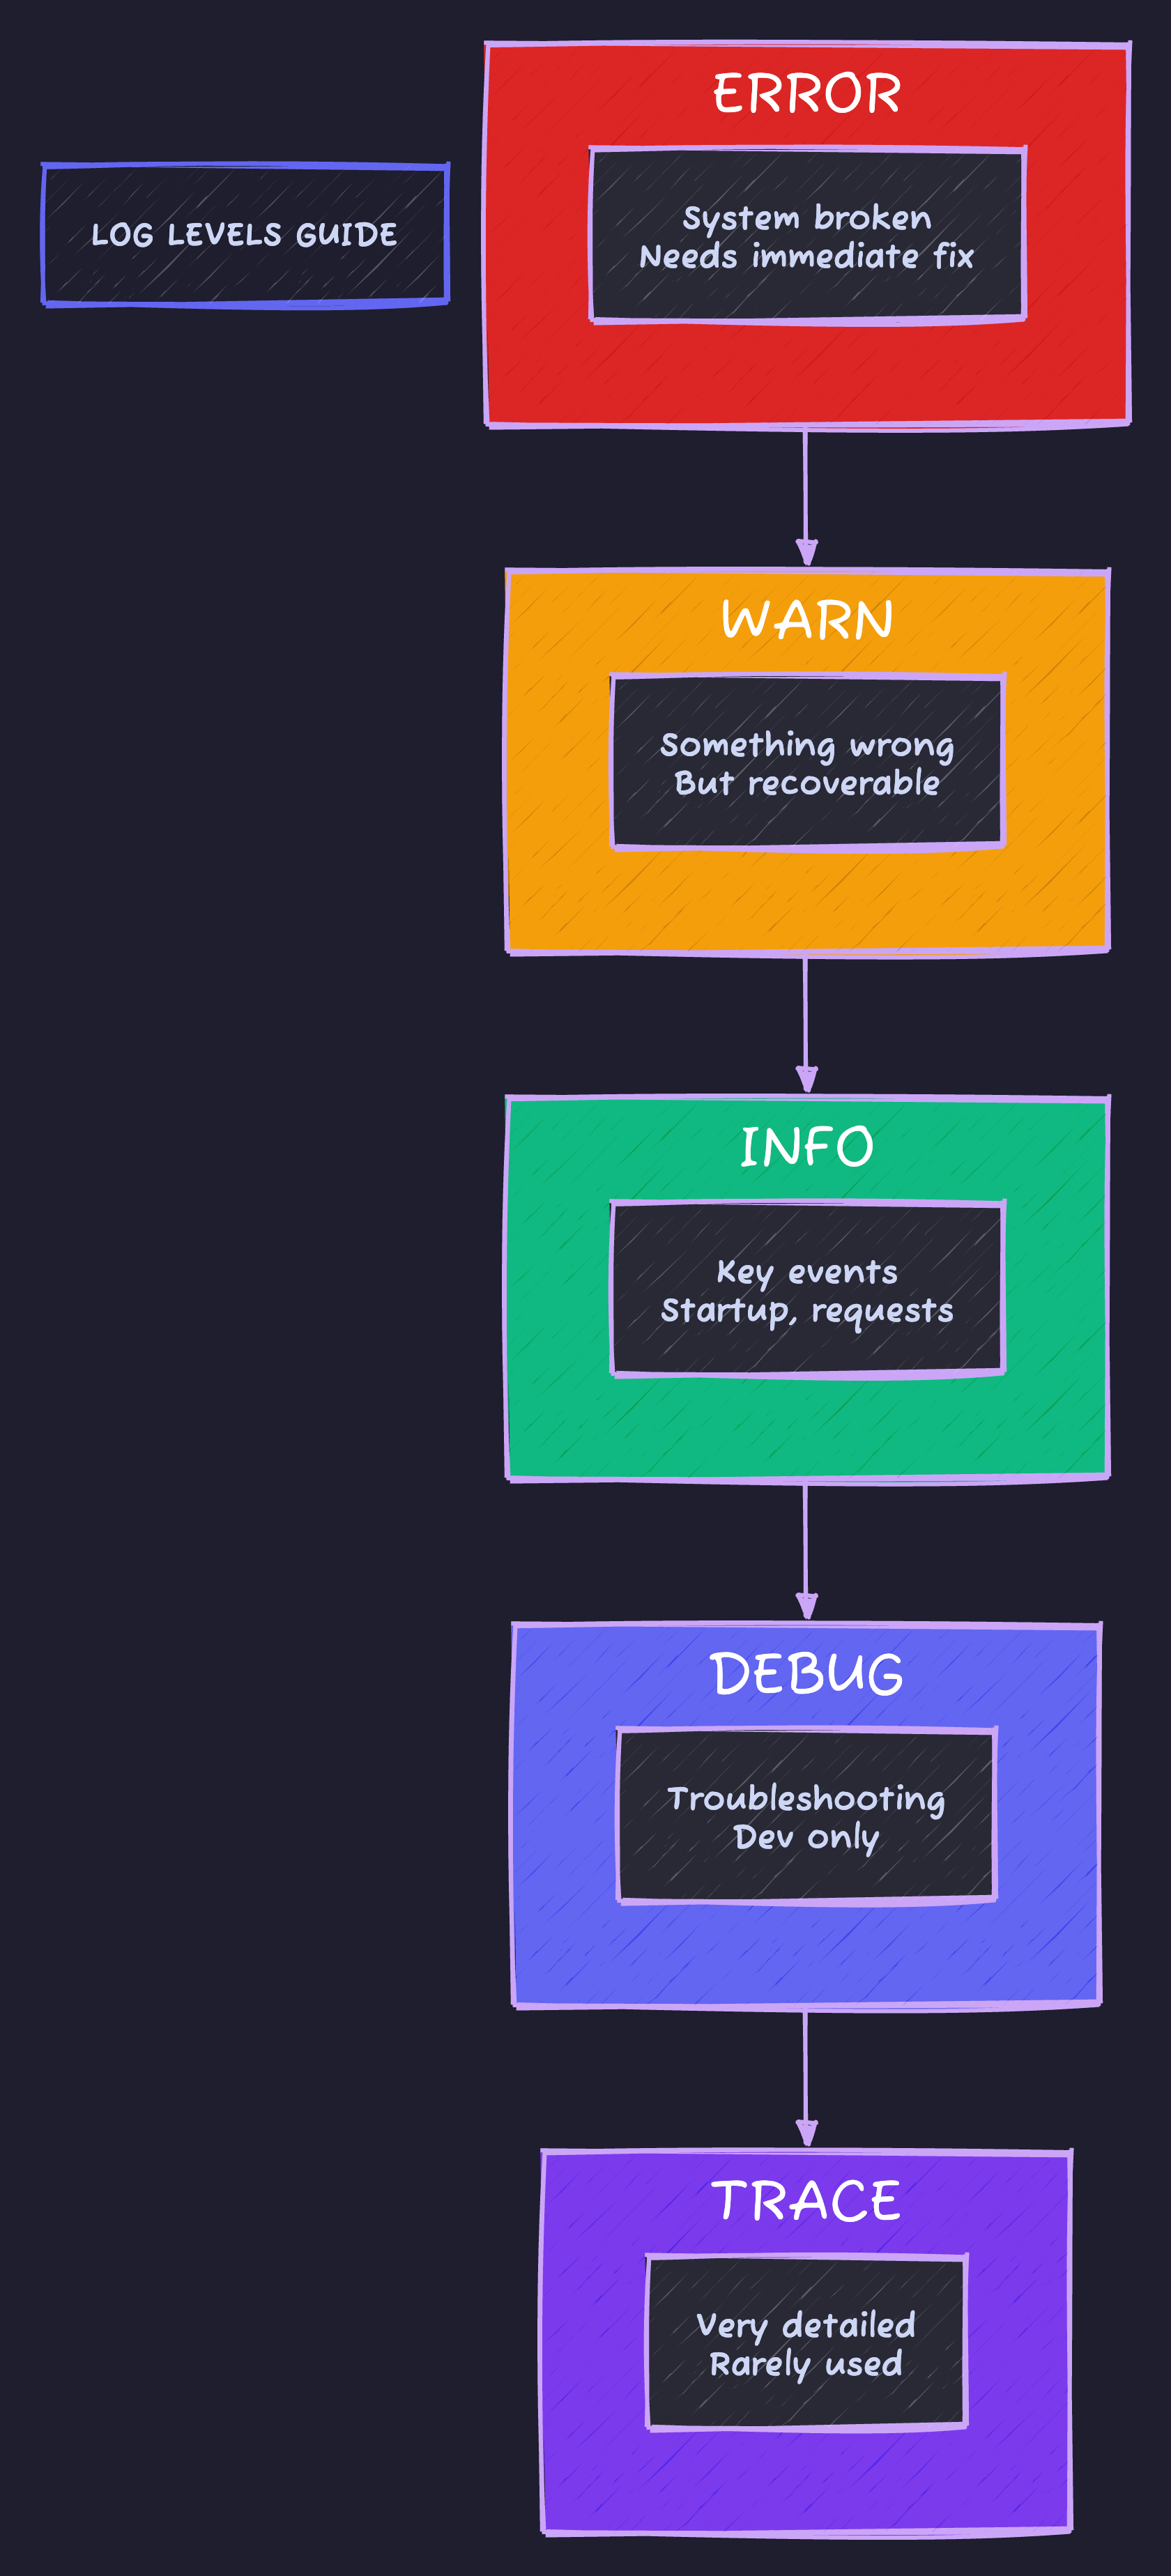
Production recommendation: Application code at INFO, framework code at WARN, third-party at ERROR. ERROR triggers alerts, WARN needs investigation but isn’t urgent.
Basic Logging Patterns
import org.slf4j.Logger;
import org.slf4j.LoggerFactory;

@Service
public class OrderService {

    // One logger per class, static final
    private static final Logger log = LoggerFactory.getLogger(OrderService.class);

    // Or with Lombok: @Slf4j on class

    public Order createOrder(CreateOrderRequest request) {
        // ✅ Good: Parameterized logging (no string concatenation)
        log.info("Creating order for user: {}", request.getUserId());

        // ❌ Bad: String concatenation (evaluated even if log level disabled)
        log.debug("Creating order for user: " + request.getUserId());

        // ✅ Good: Check level for expensive operations
        if (log.isDebugEnabled()) {
            log.debug("Order details: {}", expensiveSerialize(request));
        }

        try {
            Order order = processOrder(request);
            log.info("Order created: orderId={}, total={}", order.getId(), order.getTotal());
            return order;
        } catch (InsufficientInventoryException e) {
            // ✅ Good: Log exception with context
            log.error("Failed to create order: userId={}, reason={}",
                request.getUserId(), e.getMessage(), e);
            throw e;
        }
    }
}
MDC: The Secret Weapon for Request Tracing
MDC (Mapped Diagnostic Context) attaches context to every log line in a thread.
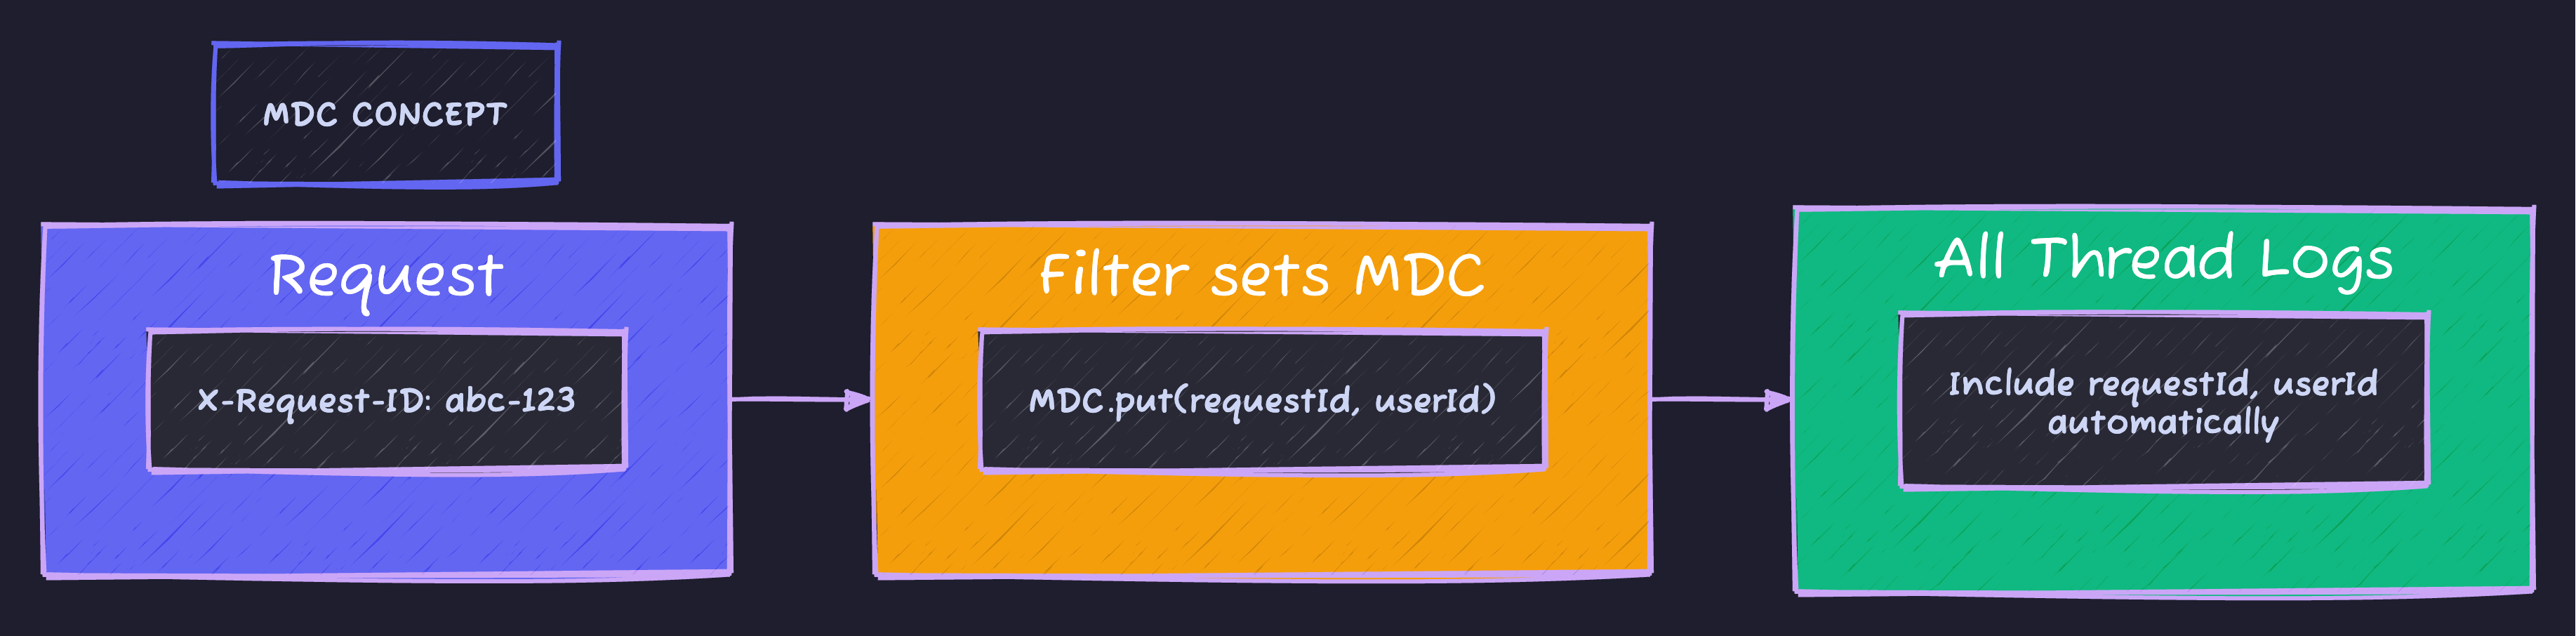
Once set in a filter, every log in that thread automatically includes the requestId and userId. Search logs by requestId to trace the entire request flow.
MDC Filter Implementation
@Component
@Order(Ordered.HIGHEST_PRECEDENCE)
public class RequestTracingFilter extends OncePerRequestFilter {

    private static final String REQUEST_ID_HEADER = "X-Request-ID";
    private static final String REQUEST_ID_MDC_KEY = "requestId";
    private static final String USER_ID_MDC_KEY = "userId";

    @Override
    protected void doFilterInternal(HttpServletRequest request,
                                    HttpServletResponse response,
                                    FilterChain filterChain) throws ServletException, IOException {
        try {
            // Get or generate request ID
            String requestId = request.getHeader(REQUEST_ID_HEADER);
            if (requestId == null || requestId.isBlank()) {
                requestId = UUID.randomUUID().toString().substring(0, 8);
            }

            // Set MDC values
            MDC.put(REQUEST_ID_MDC_KEY, requestId);
            MDC.put("method", request.getMethod());
            MDC.put("path", request.getRequestURI());

            // Add user ID if authenticated
            Authentication auth = SecurityContextHolder.getContext().getAuthentication();
            if (auth != null && auth.isAuthenticated()) {
                MDC.put(USER_ID_MDC_KEY, auth.getName());
            }

            // Add request ID to response header for client correlation
            response.setHeader(REQUEST_ID_HEADER, requestId);

            filterChain.doFilter(request, response);
        } finally {
            // CRITICAL: Always clear MDC to prevent memory leaks
            MDC.clear();
        }
    }
}
Structured JSON Logging
logback-spring.xml
<?xml version="1.0" encoding="UTF-8"?>
<configuration>

    <!-- Console output for development -->
    <springProfile name="dev,local">
        <appender name="CONSOLE" class="ch.qos.logback.core.ConsoleAppender">
            <encoder>
                <pattern>%d{HH:mm:ss.SSS} %highlight(%-5level) [%thread] %cyan(%logger{36}) - %msg%n</pattern>
            </encoder>
        </appender>

        <root level="INFO">
            <appender-ref ref="CONSOLE"/>
        </root>
    </springProfile>

    <!-- JSON output for production (Elastic, Datadog, etc.) -->
    <springProfile name="prod,staging">
        <appender name="JSON" class="ch.qos.logback.core.ConsoleAppender">
            <encoder class="net.logstash.logback.encoder.LogstashEncoder">
                <includeMdcKeyName>requestId</includeMdcKeyName>
                <includeMdcKeyName>userId</includeMdcKeyName>
                <includeMdcKeyName>method</includeMdcKeyName>
                <includeMdcKeyName>path</includeMdcKeyName>

                <!-- Custom fields -->
                <customFields>{"service":"my-service","env":"${ENVIRONMENT:-unknown}"}</customFields>

                <!-- Stack trace formatting -->
                <throwableConverter class="net.logstash.logback.stacktrace.ShortenedThrowableConverter">
                    <maxDepthPerThrowable>30</maxDepthPerThrowable>
                    <shortenedClassNameLength>20</shortenedClassNameLength>
                    <rootCauseFirst>true</rootCauseFirst>
                </throwableConverter>
            </encoder>
        </appender>

        <root level="INFO">
            <appender-ref ref="JSON"/>
        </root>
    </springProfile>

    <!-- Logger levels -->
    <logger name="io.techyowls" level="DEBUG"/>
    <logger name="org.springframework" level="INFO"/>
    <logger name="org.hibernate.SQL" level="DEBUG"/>
    <logger name="org.hibernate.type.descriptor.sql" level="TRACE"/>

</configuration>
Sample JSON Output
{
  "@timestamp": "2024-01-15T10:23:45.123Z",
  "@version": "1",
  "message": "Order created successfully",
  "logger_name": "io.techyowls.order.OrderService",
  "thread_name": "http-nio-8080-exec-5",
  "level": "INFO",
  "level_value": 20000,
  "requestId": "abc-12345",
  "userId": "user-67890",
  "method": "POST",
  "path": "/api/orders",
  "service": "order-service",
  "env": "production",
  "orderId": "ord-11111",
  "total": 299.99
}
Logging Sensitive Data
@Service
public class UserService {

    // ❌ NEVER log passwords, tokens, full card numbers
    public void login(LoginRequest request) {
        log.info("Login attempt: {}", request);  // Might log password!
    }

    // ✅ Mask sensitive data
    public void login(LoginRequest request) {
        log.info("Login attempt for user: {}", request.getUsername());
    }

    // ✅ Create a safe-to-log version
    public void processPayment(PaymentRequest request) {
        log.info("Processing payment: {}", request.toLogSafe());
    }
}
public record PaymentRequest(
String cardNumber,
String cvv,
BigDecimal amount
) {
public String toLogSafe() {
String maskedCard = "****" + cardNumber.substring(cardNumber.length() - 4);
return String.format("PaymentRequest[card=%s, amount=%s]", maskedCard, amount);
}
}Automatic Masking with Custom Pattern
@Component
public class SensitiveDataMasker {

    private static final Pattern CARD_PATTERN = Pattern.compile("\\b\\d{13,16}\\b");
    private static final Pattern EMAIL_PATTERN = Pattern.compile("\\b[A-Za-z0-9._%+-]+@[A-Za-z0-9.-]+\\.[A-Z|a-z]{2,}\\b");

    public String mask(String input) {
        String result = CARD_PATTERN.matcher(input)
            .replaceAll(match -> "****" + match.group().substring(match.group().length() - 4));
        result = EMAIL_PATTERN.matcher(result)
            .replaceAll(match -> mask(match.group(), '@'));
        return result;
    }

    private String mask(String email, char delimiter) {
        int atIndex = email.indexOf(delimiter);
        return "***@" + email.substring(atIndex + 1);
    }
}
Performance Logging
@Aspect
@Component
public class PerformanceLoggingAspect {

    private static final Logger log = LoggerFactory.getLogger(PerformanceLoggingAspect.class);

    @Around("@annotation(io.techyowls.logging.LogExecutionTime)")
    public Object logExecutionTime(ProceedingJoinPoint joinPoint) throws Throwable {
        long startTime = System.currentTimeMillis();
        String methodName = joinPoint.getSignature().toShortString();

        try {
            Object result = joinPoint.proceed();
            long duration = System.currentTimeMillis() - startTime;

            if (duration > 1000) {
                log.warn("Slow method execution: method={}, duration_ms={}", methodName, duration);
            } else {
                log.debug("Method execution: method={}, duration_ms={}", methodName, duration);
            }

            return result;
        } catch (Exception e) {
            long duration = System.currentTimeMillis() - startTime;
            log.error("Method failed: method={}, duration_ms={}, error={}",
                methodName, duration, e.getMessage());
            throw e;
        }
    }
}

@Target(ElementType.METHOD)
@Retention(RetentionPolicy.RUNTIME)
public @interface LogExecutionTime {}@Service
public class OrderService {
@LogExecutionTime
public Order createOrder(CreateOrderRequest request) {
// Method execution time automatically logged
}
}Request/Response Logging
@Component
@Order(Ordered.HIGHEST_PRECEDENCE + 1)
public class RequestResponseLoggingFilter extends OncePerRequestFilter {

    private static final Logger log = LoggerFactory.getLogger(RequestResponseLoggingFilter.class);

    @Override
    protected void doFilterInternal(HttpServletRequest request,
                                    HttpServletResponse response,
                                    FilterChain filterChain) throws ServletException, IOException {

        long startTime = System.currentTimeMillis();

        // Wrap request to read body multiple times
        ContentCachingRequestWrapper wrappedRequest = new ContentCachingRequestWrapper(request);
        ContentCachingResponseWrapper wrappedResponse = new ContentCachingResponseWrapper(response);

        try {
            filterChain.doFilter(wrappedRequest, wrappedResponse);
        } finally {
            long duration = System.currentTimeMillis() - startTime;
            logRequest(wrappedRequest, wrappedResponse, duration);
            wrappedResponse.copyBodyToResponse();
        }
    }

    private void logRequest(ContentCachingRequestWrapper request,
                           ContentCachingResponseWrapper response,
                           long duration) {
        int status = response.getStatus();
        String level = status >= 500 ? "ERROR" : status >= 400 ? "WARN" : "INFO";

        // Structured log entry
        log.atLevel(Level.valueOf(level))
            .addKeyValue("method", request.getMethod())
            .addKeyValue("path", request.getRequestURI())
            .addKeyValue("status", status)
            .addKeyValue("duration_ms", duration)
            .addKeyValue("query", request.getQueryString())
            .log("HTTP Request completed");
    }

    @Override
    protected boolean shouldNotFilter(HttpServletRequest request) {
        String path = request.getRequestURI();
        // Skip health checks and static resources
        return path.startsWith("/actuator") || path.startsWith("/static");
    }
}
Log Aggregation Query Examples
With structured logging, you can query your log aggregation tool (Elasticsearch, Datadog, etc.):
# Find all logs for a specific request
requestId: "abc-12345"

# Find all errors in the last hour
level: "ERROR" AND @timestamp: [now-1h TO now]

# Find slow requests
duration_ms: >1000

# Find all orders for a user
userId: "user-67890" AND message: *order*

# Find error rate by endpoint
level: "ERROR" | stats count by path

# Find p99 response times
* | percentile(duration_ms, 99) by path
Anti-Patterns to Avoid
// ❌ Don't: Log and throw (double logging)
try {
    processOrder(order);
} catch (Exception e) {
    log.error("Failed to process order", e);
    throw e;  // Will be logged again at a higher level
}

// ✅ Do: Log at the appropriate level only
try {
    processOrder(order);
} catch (Exception e) {
    throw new OrderProcessingException("Failed to process order: " + order.getId(), e);
}

// ❌ Don't: Log in loops
for (User user : users) {
    log.info("Processing user: {}", user.getId());
    process(user);
}

// ✅ Do: Log summary
log.info("Processing {} users", users.size());
for (User user : users) {
    process(user);
}
log.info("Processed {} users successfully", users.size());

// ❌ Don't: Use System.out.println
System.out.println("Debug: " + value);

// ✅ Do: Use logger
log.debug("Debug value: {}", value);

// ❌ Don't: Log getters (might have side effects or be expensive)
log.debug("User: {}", user.getFullProfile());  // Might trigger lazy loading!

// ✅ Do: Log specific fields
log.debug("User: id={}, name={}", user.getId(), user.getName());
Code Sample
Full working example: github.com/Moshiour027/techyowls-io-blog-public/logging-best-practices
Summary
| Practice | Impact |
|---|---|
| MDC for request tracing | Find any request in millions of logs |
| Structured JSON logging | Queryable, parseable logs |
| Appropriate log levels | Signal vs noise |
| Parameterized messages | Performance, security |
| Mask sensitive data | Compliance, security |
| Performance logging | Identify bottlenecks |
Golden rules:
- Every log line should answer: What happened? To whom? When? Why?
- Use MDC for request correlation
- JSON in production, human-readable in development
- Never log sensitive data
- Log at appropriate levels
Good logs turn a 3 AM debugging session into a 5-minute investigation.
Advertisement
Moshiour Rahman
Software Architect & AI Engineer
Enterprise software architect with deep expertise in financial systems, distributed architecture, and AI-powered applications. Building large-scale systems at Fortune 500 companies. Specializing in LLM orchestration, multi-agent systems, and cloud-native solutions. I share battle-tested patterns from real enterprise projects.
Related Articles
GitHub Actions CI/CD: From Push to Production in 10 Minutes
Build a complete CI/CD pipeline for Spring Boot: automated tests, Docker builds, staging deployments, and production releases with approval gates.
DevOpsPrometheus and Grafana: Complete Monitoring Stack Tutorial
Set up production monitoring with Prometheus and Grafana. Learn metrics collection, alerting, dashboards, and best practices for observability.
DevOpsDocker Compose for Spring Boot: Local Dev to Production
Containerize Spring Boot apps with Docker Compose. Multi-service setup, health checks, volumes, and production deployment patterns.
Comments
Comments are powered by GitHub Discussions.
Configure Giscus at giscus.app to enable comments.